
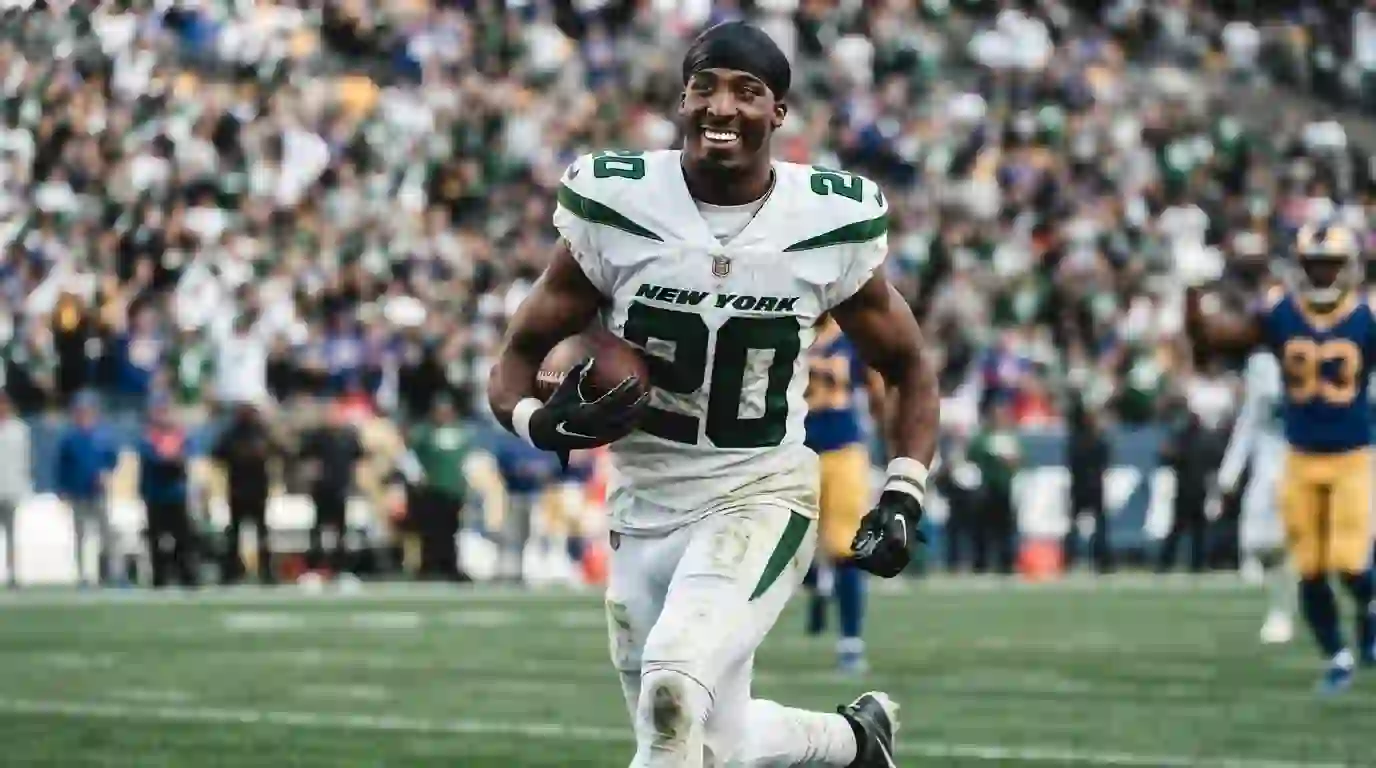
Breece Hall 2025 Season Stats: The 1,065-Yard Breakdown That Earned a $45.75M Jets Extension
Breece Hall finally cracked 1,000 rushing yards in 2025, and the raw number still doesn’t tell you much. Breece Hall’s box score looks like a top-10 back’s; his game log reads like a player fighting his own offense. Volume, efficiency, matchup quality and supporting-cast context all pull in different directions. This breakdown separates what he controlled from what he didn’t, using every game, every split and the advanced numbers behind them.
Breece Hall Player Profile
| Detail | Information |
|---|---|
| Full Name | Breece Hall |
| Position | Running Back |
| Jersey Number | #20 |
| Team | New York Jets |
| Age / Date of Birth | 25 — May 31, 2001 |
| Birthplace | Omaha, Nebraska |
| Height / Weight | 5’11” / 217 lbs |
| College | Iowa State |
| NFL Draft | 2022, Round 2, Pick 36 (New York Jets) |
| Combine Testing | 4.39s 40-yard dash, 40.0″ vertical, 126″ broad jump |
| NFL Experience | 5 seasons (2022–2026) |
| 2025 Highlight | First Jets 1,000-yard rusher since Chris Ivory (2015) |
| Current Contract | 3 years, $45.75M ($29M guaranteed), signed May 8, 2026 |
| Contract Rank | 3rd-highest-paid NFL running back ($15.25M AAV) |
The Lead
Seventeen games, three wins, and one running back who kept producing anyway. The 2025 New York Jets season ran from a 34–32 opening-day heartbreaker against Pittsburgh on September 7 to a 35–8 demolition in Buffalo on January 4, and Breece Hall carried the offense through nearly all of it. He finished with 243 carries for 1,065 rushing yards and four rushing touchdowns, plus 36 receptions for 350 yards and another score — 1,415 yards from scrimmage on 279 touches. It was the first 1,000-yard rushing season by a Jet in a decade, and it happened inside an offense that ranked 29th in both total yards and points.
How Hall got there is stranger than the total suggests. He opened at 5.6 yards per carry, peaked in October at 5.28, then watched his efficiency collapse to 3.61 in November as the Jets’ quarterback situation cycled through three starters and their defense stopped generating turnovers entirely. His two best games came against the worst run defense in football and, improbably, the sixth-best. The following pages break down every carry, every split and every advanced metric that explains the gap between the box score and the tape.
Season Overview: Breece Hall’s 2025 at a Glance
| Information | Match Details |
|---|---|
| Event | NFL 2025 Regular Season |
| Game | New York Jets vs. 2025 Schedule (17 games) |
| Date | September 7, 2025 – January 4, 2026 |
| Venue | MetLife Stadium (8 home games) + Tottenham Hotspur Stadium, London (Week 6) |
| Attendance | 599,091 total at MetLife — 74,886 per game (5th in the NFL) |
| Winner | Breece Hall — career-high 1,065 rushing yards; Jets finished 3-14 |
| Final Score | 299 points scored, 502 points allowed (17.6 PPG vs. 29.6 PPG) |
| Broadcast | CBS, FOX, NBC, ESPN, NFL Network, Amazon Prime Video |
Core Statistical Overview: Breece Hall Rushing Yards vs. the 2025 NFL
The defining tension in Breece Hall stats from 2025 sits between volume and efficiency. He ranked 11th among 55 qualified halfbacks in carries and 15th in rushing yards, yet only 25th in yards per carry and 38th in rushing touchdowns. He was fed like a featured back and produced like a solid one, and the gap between those two descriptions is where the argument about his value lives.
| Metric | Breece Hall 2025 | NFL Rank (of 55 qualified HBs) | Jets Team 2025 | NFL Rank (of 32) |
|---|---|---|---|---|
| Carries | 243 | 11th | 456 | 19th per game (26.8) |
| Rushing Yards | 1,065 | 15th | 2,096 | 10th (123.3/game) |
| Yards Per Carry | 4.4 | 25th | 4.6 | 7th |
| Rushing Touchdowns | 4 | 38th | 11 | 24th per game (0.6) |
| Missed Tackles Forced | 40 | 19th | — | — |
| Yards After Contact / Att | 3.01 | 31st | — | — |
| Explosive Runs (10+) | 26 | — | — | — |
| Receptions / Targets | 36 / 48 | 15th (rec) | — | — |
| Receiving Yards | 350 | 9th among HBs | — | 32nd passing (140.3/game) |
| Scrimmage Yards | 1,415 | — | 4,481 | 29th (263.6/game) |
| Fumbles (Lost) | 2 (2) | 32nd | 1.4 giveaways/game | 20th |
Volume Share: One Back, Half the Offense
Hall took 53.3% of the Jets’ rushing attempts and produced 50.8% of their rushing yards — a nearly identical share, which tells you his 4.4 average sat right on the team’s 4.6 mark. His 1,415 scrimmage yards accounted for 31.6% of New York’s 4,481 total offensive yards. No other Jets running back cleared 240 rushing yards.
- Carry share vs. production share: 53.3% of attempts, 50.8% of yards — Hall was asked to be the offense, not complement it.
- Snap dominance: Hall played 640 offensive snaps; the rest of the backfield combined for 421, giving him a 60.3% share of all running back snaps.
Breece Hall Yards Per Carry: The Efficiency Problem
A 4.4-yard average sounds acceptable until you compare it to the Jets’ own team number of 4.6 and note that quarterback scrambles inflated that figure. Justin Fields, Tyrod Taylor and Brady Cook combined for 111 carries at 5.18 yards per attempt — a franchise record for the position. Hall, running between the tackles against stacked fronts, averaged nearly a full yard less per attempt than his own quarterbacks did on designed runs and scrambles.
- Box counts: Hall faced an average of 7.22 defenders in the box per carry, and 13.6% of his rushes were stopped at or behind the line of scrimmage.
- Yards after contact: 692 of his 1,065 rushing yards (65%) came after first contact, which means the line was giving him very little and he was manufacturing the rest himself.
The Passing-Game Regression
Hall’s receiving usage fell off a cliff in his fourth season. After 76 catches in 2023 and 57 in 2024, he dropped to 36 receptions on 48 targets — a 43% decline in targets from his 2023 peak. His 9.7 yards per reception was actually his career best, and his 75% catch rate with a single drop was excellent. The problem was opportunity, not execution.
- Route participation: Hall ran 256 routes across 349 pass snaps and was targeted on just 18.8% of them.
- Efficiency when used: 1.37 yards per route run and 9.2 yards after the catch per reception — the Jets simply stopped throwing him the ball in the second half of the year.
Ball Security and Touch Distribution
Hall fumbled twice and lost both, a sharp improvement on the six fumbles he put on the ground in 2024. His 279 touches came at a rate of 17.4 per game, and he touched the ball on 43.9% of the snaps he played. The workload was heavy but not reckless, and he missed only the meaningless Week 18 finale with a knee issue.
Breece Hall Game Log: Month-by-Month Breakdown
September: Hot Start, Winless Month
| Weeks | Games | Att | Rush Yds | YPC | Rec | Rec Yds | TD | Team Record |
|---|---|---|---|---|---|---|---|---|
| 1–4 | vs PIT, vs BUF, @ TB, @ MIA | 52 | 238 | 4.58 | 13 | 108 | 0 | 0-4 |
- Hall opened with 107 yards on 19 carries against Pittsburgh and never scored in the month, as the Jets lost four straight by a combined 30 points.
- His worst game came in Week 3 at Tampa Bay (9 carries, 21 yards) against a top-five run defense that dared Justin Fields to throw.
- The passing game still leaned on him early: 13 catches for 108 yards, his heaviest receiving month of the season by volume.
October: Peak Efficiency
| Weeks | Games | Att | Rush Yds | YPC | Rec | Rec Yds | TD | Team Record |
|---|---|---|---|---|---|---|---|---|
| 5–8 | vs DAL, vs DEN, vs CAR, @ CIN | 65 | 343 | 5.28 | 8 | 70 | 2 | 1-3 |
- This was Hall’s best month and it produced the Jets’ first win: 18 carries for 133 yards and two touchdowns in a 39–38 shootout at Cincinnati, the worst run defense in football.
- Week 5 against Dallas produced his most explosive line — 113 yards on 14 carries at 8.1 per attempt — in a game the Jets still lost 37–22.
- The Denver game in London was the outlier: 22 carries, his second-highest total of the season, for just 59 yards at 2.7 per attempt against the NFL’s second-ranked run defense.
November: Volume Without Efficiency
| Weeks | Games | Att | Rush Yds | YPC | Rec | Rec Yds | TD | Team Record |
|---|---|---|---|---|---|---|---|---|
| 10–13 | vs CLE, @ NE, @ BAL, vs ATL | 70 | 253 | 3.61 | 9 | 131 | 2 | 2-2 |
- Hall’s carry total peaked at 70 while his average bottomed out at 3.61 — the clearest sign the Jets were forcing volume rather than earning it.
- He salvaged the Cleveland win with a 42-yard catch-and-run touchdown, accounting for 125 of the Jets’ 169 total yards (74%) in that game.
- Week 12 in Baltimore flipped the script: 16 carries for 44 yards on the ground, but 4 catches for 75 yards through the air, his best receiving game of the season.
December: The Collapse Around Him
| Weeks | Games | Att | Rush Yds | YPC | Rec | Rec Yds | TD | Team Record |
|---|---|---|---|---|---|---|---|---|
| 14–17 | vs MIA, @ JAX, @ NO, vs NE | 56 | 231 | 4.13 | 6 | 41 | 1 | 0-4 |
- The Jets were outscored by 107 points in December and Hall’s touches dropped to 14 per game as New York played from behind constantly.
- His worst outing came at Jacksonville against the league’s No. 1 run defense: 12 carries, 23 yards, 1.9 per attempt.
- He closed the month with his second-best game — 14 carries for 111 yards and a 59-yard touchdown run against a top-10 New England front — a reminder the ceiling was still there.
January: The Knee That Ended It
| Weeks | Games | Att | Rush Yds | YPC | Rec | Rec Yds | TD | Team Record |
|---|---|---|---|---|---|---|---|---|
| 18 | @ BUF | DNP | — | — | — | — | — | 0-1 |
- Hall sat out the finale in Buffalo with a knee injury, finishing one carry short of nothing and closing at 1,065 yards.
- The Jets managed 122 total yards without him and lost 35–8, their 14th defeat.
- His absence underscored the season’s central fact: he played 16 of 17 games and carried the offense in almost all of them.
Breece Hall Player Statistics
| Category | 2025 Total | Career Total (4 seasons) |
|---|---|---|
| Games Played / Started | 16 / 16 | 56 / 50 |
| Rushing Attempts | 243 | 755 |
| Breece Hall Rushing Yards | 1,065 | 3,398 |
| Yards Per Carry | 4.4 | 4.5 |
| Rushing Touchdowns | 4 | 18 |
| Longest Run | 59 yards | 83 yards |
| Receptions / Targets | 36 / 48 | 188 / 250 |
| Receiving Yards | 350 | 1,642 |
| Receiving Touchdowns | 1 | 9 |
| Scrimmage Yards | 1,415 | 5,040 |
| Total Touchdowns | 5 | 27 |
| Fumbles (Lost) | 2 (2) | 11 (5) |
Hall’s 2025 season was the heaviest workload of his career and the first time he turned volume into four figures. He set career highs in carries (243) and rushing yards (1,065) while posting a career-low in receptions since his injury-shortened rookie year. The trade-off was structural: the Jets asked him to be a between-the-tackles grinder rather than the dual-threat weapon who caught 76 passes in 2023, and the raw production reflected that choice.
New York Jets Supporting Cast Player Statistics
| Player | Position | Games | Key 2025 Production |
|---|---|---|---|
| Justin Fields | QB | 9 | 128/204, 1,259 pass yds, 7 TD, 1 INT, 89.5 rating; 71 car, 383 rush yds, 4 TD |
| Tyrod Taylor | QB | 6 | 80/134, 779 pass yds, 5 TD, 5 INT, 72.9 rating; 27 car, 143 rush yds |
| Brady Cook | QB | 5 | 88/153, 739 pass yds, 2 TD, 7 INT, 55.4 rating; 13 car, 49 rush yds |
| Garrett Wilson | WR | — | 395 receiving yards (3rd on team) |
| Adonai Mitchell | WR | — | 464 receiving yards |
| Mason Taylor | TE | — | 44 receptions, 369 receiving yards |
| Isaiah Davis | RB | 16 | 43 car, 236 yds (5.5 YPC), 1 TD; 21 rec, 186 yds |
| Braelon Allen | RB | 4 | 18 car, 76 yds (4.2 YPC), 1 TD; 2 rec, 17 yds |
The Jets used three starting quarterbacks and none threw for 1,300 yards. Fields was competent when healthy (89.5 rating, one interception in nine games) but landed on injured reserve, Taylor threw five picks in six games, and undrafted rookie Brady Cook posted a 55.4 rating with seven interceptions in five starts. Behind Hall, Isaiah Davis was genuinely efficient — 5.5 yards per carry on 43 attempts — but barely used, and Braelon Allen’s season ended after four games with a knee injury.
Statistical Leaders Summary: Breece Hall vs. the Rest of the Jets Backfield
| Category | Breece Hall | Rest of Jets Backfield |
|---|---|---|
| Leading Rusher | Breece Hall — 1,065 yds (243 att) | Isaiah Davis — 236 yds (43 att) |
| Second Leading Rusher | Not applicable — next Jets RB finished 829 yards behind | Braelon Allen — 76 yds (18 att) |
| Top Receiver (RB) | Breece Hall — 36 rec, 350 yds, 1 TD | Isaiah Davis — 21 rec, 186 yds |
| Yards Per Carry | 4.4 (243 attempts) | 4.59 (90 attempts) |
| Total Scrimmage Yards | 1,415 on 279 touches (5.07 per touch) | 620 on 114 touches (5.44 per touch) |
| Rushing Touchdowns | 4 | 2 (Davis 1, Allen 1) |
The comparison cuts both ways. Hall absorbed 73% of the backfield’s carries and 71% of its snaps, which is why his per-attempt average sits below Davis’s. Davis ran almost exclusively against light boxes in relief, and the 1.5-yard-per-carry gap between them shrinks to 0.19 when you weight for down, distance and defensive front. Volume ate the efficiency; that is the arithmetic of a workhorse role in a bad offense.
Why Breece Hall Won 2025: Four Measurable Advantages
He Stayed Available
Sixteen starts in seventeen games is the least glamorous and most valuable thing Hall did. After tearing an ACL in Week 7 of his rookie season and managing a heavy 2024 load, he absorbed 279 touches and missed only a dead-rubber finale. Availability is what turned 4.4 yards per carry into four figures.
| Season | Games | Carries | Rush Yds | Scrimmage Yds |
|---|---|---|---|---|
| 2022 | 7 | 80 | 463 | 681 |
| 2023 | 17 | 223 | 994 | 1,585 |
| 2024 | 16 | 209 | 876 | 1,359 |
| 2025 | 16 | 243 | 1,065 | 1,415 |
At an Elite Clip, He Forced Missed Tackles
Hall broke 40 tackles as a runner, ranking 19th among 55 qualified backs, with a 19.3% broken-tackle rate. His 81.1% positive-run rate — the share of carries gaining at least some yardage — was genuinely strong, and 65% of his rushing yards came after contact. The line was not opening lanes; Hall was creating them.
| Contact Metric | Hall 2025 | Rank |
|---|---|---|
| Missed Tackles Forced | 40 | 19th / 55 |
| Yards After Contact / Att | 3.01 | 31st / 55 |
| Yards After Contact (Total) | 692 | — |
| % of Rushing Yards After Contact | 65.0% | — |
He Delivered in the Games the Jets Actually Won
This is the single most telling split in the entire season. Hall averaged 4.90 yards per carry in New York’s three victories and 4.22 in its 13 defeats — and he scored four of his five total touchdowns in those three wins.
| Split | Games | Att | Rush Yds | YPC | Total TD |
|---|---|---|---|---|---|
| Jets Wins | 3 | 58 | 284 | 4.90 | 4 |
| Jets Losses | 13 | 185 | 781 | 4.22 | 1 |
He Protected the Football
After six fumbles in 2024, Hall cut that number to two in 2025. For a back touching the ball 17.4 times per game behind an offensive line that allowed pressure consistently, that improvement mattered — the Jets tied for the league lead with nine fumbles lost as a team, and Hall was not the reason.
Why the Jets Offense Lost 2025: Three Execution Failures
The Passing Game Was Historically Bad
New York finished 32nd in net passing yards per game (140.3), 29th in total yards (263.6) and 29th in points (17.6). Three quarterbacks combined for 11 touchdown passes against 13 interceptions. Defenses stacked the box against Hall accordingly — his 7.22 average box defenders per carry is the direct consequence.
| Jets Offensive Metric | 2025 Value | NFL Rank |
|---|---|---|
| Points Per Game | 17.6 | 29th |
| Total Yards Per Game | 263.6 | 29th |
| Net Passing Yards Per Game | 140.3 | 32nd |
| Third-Down Conversion % | 34.9% | 26th |
| Red Zone Touchdown % | 44.7% | 31st |
| Yards Per Play | 4.4 | 29th |
The Defense Produced No Takeaways At All
The 2025 Jets became the first team since 1933 to play a full season without a single interception. They finished 32nd in turnover margin at -1.1 per game, and 32nd in takeaways per game at 0.2. Short fields never materialized, which meant Hall’s drives started deep and his carry totals shrank whenever New York fell behind.
| Defensive Metric | 2025 Value | NFL Rank |
|---|---|---|
| Interceptions | 0 | 32nd (first since 1933) |
| Takeaways Per Game | 0.2 | 32nd |
| Turnover Margin Per Game | -1.1 | 32nd |
| Points Allowed Per Game | 29.6 | 31st |
| Rush Yards Allowed Per Game | 139.5 | 29th |
Third Downs and the Red Zone Killed Drives
Converting 34.9% of third downs (26th) and scoring touchdowns on just 44.7% of red zone trips (31st) is how you finish 29th in scoring despite ranking 10th in rushing. The Jets moved the ball well enough on early downs to feed Hall, then stalled before paydirt — which is exactly why Hall scored four rushing touchdowns on 243 carries, a 1.6% touchdown rate that ranked near the bottom of the league.
Historical Context & Advanced Insights
Career Trajectory: Four Seasons of Breece Hall Stats
| Season | G | Att | Rush Yds | YPC | Rush TD | Rec | Rec Yds | Rec TD | Scrim Yds |
|---|---|---|---|---|---|---|---|---|---|
| 2022 (ACL, Wk 7) | 7 | 80 | 463 | 5.8 | 4 | 19 | 218 | 1 | 681 |
| 2023 | 17 | 223 | 994 | 4.5 | 5 | 76 | 591 | 4 | 1,585 |
| 2024 | 16 | 209 | 876 | 4.2 | 5 | 57 | 483 | 3 | 1,359 |
| 2025 | 16 | 243 | 1,065 | 4.4 | 4 | 36 | 350 | 1 | 1,415 |
| Career | 56 | 755 | 3,398 | 4.5 | 18 | 188 | 1,642 | 9 | 5,040 |
Hall has now posted three consecutive seasons with at least 1,350 scrimmage yards, something only five other players in Jets franchise history have managed. His 5.8 yards per carry as a rookie before the ACL tear remains his efficiency high-water mark, and every season since has landed between 4.2 and 4.6 — remarkably stable for a back whose blocking has varied wildly.
Season Series Breakdown: Jets vs. the AFC East
| Opponent | Games | Jets Record | Hall Att | Hall Rush Yds | Hall YPC |
|---|---|---|---|---|---|
| Buffalo Bills | 2 | 0-2 | 10 | 29 | 2.9 |
| Miami Dolphins | 2 | 0-2 | 28 | 124 | 4.43 |
| New England Patriots | 2 | 0-2 | 28 | 169 | 6.04 |
| AFC East Total | 6 | 0-6 | 66 | 322 | 4.88 |
New York went 0-6 in the division and was outscored badly in all six. Hall’s numbers against New England were his best divisional work — 169 yards on 28 carries — including a 111-yard explosion in the Week 17 rematch. His Buffalo sample is one game’s worth of work (Week 2, 10 carries for 29 yards) because he sat out the finale injured.
Advanced Statistical Insights: EPA, Box Counts and the Efficiency Trap
Hall’s 2025 rushing EPA sat at -0.09 per attempt with a total rushing EPA of -21.07, meaning the average Hall carry made the Jets slightly worse off than an average back would have. His success rate — the share of carries gaining 40% of needed yards on first down, 60% on second, 100% on third and fourth — came in at 40.7%. Both figures are mediocre, and both are heavily context-dependent.
| Advanced Metric | 2025 Value | Note |
|---|---|---|
| EPA Per Rush | -0.09 | Slightly below replacement-level efficiency |
| Total Rushing EPA | -21.07 | Accumulated over 243 attempts |
| Success Rate | 40.7% | Mid-pack among workhorse backs |
| Explosive Run Rate (10+) | 8.6% | 26 explosive runs |
| Stuffed Rate (TFL) | 13.6% | Roughly 1 in 7 carries stopped at/behind the line |
| Avg Box Defenders Faced | 7.22 | Consistently stacked fronts |
| First Down Rate | 24.3% | 57 rushing first downs |
The critical relationship is between box count and efficiency. Hall faced 7.22 defenders in the box on average because the Jets could not throw — and he still produced 65% of his yardage after contact. That combination (heavy boxes, high after-contact share) is the signature of a back outperforming his blocking. It also explains the matchup split below, which is the single best predictive signal in his profile.
| Opponent Run Defense Tier | Games | Att | Rush Yds | YPC |
|---|---|---|---|---|
| Bottom-10 (ranks 23–32) | 6 | 89 | 467 | 5.25 |
| Middle-12 (ranks 11–22) | 4 | 67 | 282 | 4.21 |
| Top-10 (ranks 1–10) | 6 | 87 | 316 | 3.63 |
A 1.62-yard-per-carry swing between the easiest and hardest tiers says Hall was not the variable — the blocking and the down-and-distance situation were. When the Jets faced a defense that could be run on, Hall ran on it. When they faced a top-10 front with a quarterback nobody respected, 3.63 yards per carry was the ceiling.
Breece Hall Contract Extension: What the 2025 Season Earned
Hall’s offseason ran the full gauntlet. The Jets declined to extend him in 2025, listened to trade offers at the deadline after a 1-7 start, then watched him post a career year. General manager Darren Mougey said in February that Hall “is going nowhere,” New York applied the non-exclusive franchise tag worth $14.293 million in March, and the two sides agreed to a three-year, $45.75 million extension on May 8, 2026.
| Contract Detail | Value |
|---|---|
| Length | 3 years (through 2028) |
| Total Value | $45.75 million |
| Guaranteed Money | $29 million |
| Average Annual Value | $15.25 million |
| NFL RB Pay Rank | 3rd (behind Saquon Barkley, Christian McCaffrey) |
| Franchise Tag Value (2026) | $14.293 million |
| Year-3 Guarantee | None — Jets hold an out after 2027 |
The structure is the interesting part: $29 million guaranteed across the first two seasons with nothing guaranteed in year three. New York paid a top-three running back salary to keep its best offensive player while preserving an exit before Hall turns 28. Getting it done in May also beat the market — with Jahmyr Gibbs and Bijan Robinson both extension-eligible, waiting would have raised the price.
Breece Hall Fantasy Football Impact
Hall finished 2025 as the RB19 in half-PPR scoring despite ranking 15th in rushing yards among all backs — a gap driven almost entirely by his five total touchdowns. He posted three top-10 weekly finishes (Week 8, Week 10, Week 1) and three finishes outside the top 40 (Week 2, Week 14, Week 15), making him a volatile weekly starter whose season-long line looked steadier than his week-to-week reality.
- Volume floor: 17.4 touches per game and 60.3% of backfield snaps gave him one of the safest carry floors in the league.
- Touchdown ceiling problem: A 1.6% rushing touchdown rate and a 31st-ranked red zone offense capped his weekly upside at every turn.
- 2026 variable: Signing the extension removed the holdout risk; the addition of quarterback Geno Smith and coordinator Frank Reich is what determines whether his touchdown rate normalizes.
Game Implications & Key Lessons
What This Means for Breece Hall
- The extension validates the workload: he is under contract through 2028 as the clear featured back, with no credible competition behind him after Braelon Allen’s injury and Isaiah Davis’s limited 43-carry role.
- His 4.4 yards per carry will be the number skeptics quote; his 40 forced missed tackles and 65% after-contact share are the numbers that suggest better blocking unlocks something closer to 4.8–5.0.
- Three straight seasons over 1,350 scrimmage yards puts him in rare franchise company and gives the Jets a legitimate building block while the rest of the roster turns over.
What This Means for the Jets
- Ranking 10th in rushing and 29th in scoring is not a running back problem. It is a quarterback, third-down and red zone problem, and the front office has to solve it before Hall’s prime years are spent.
- Zero interceptions in a season and a -1.1 turnover margin per game cannot be fixed by any offensive addition; that deficit gave Hall worse field position every single week.
- New coordinator Frank Reich and quarterback Geno Smith are the variables to watch. If the passing game simply becomes average, Hall’s box count drops and his efficiency follows.
Key Lessons
- Volume hides context. 1,065 yards sounds like a breakout; 4.4 yards per carry and four touchdowns tell you the environment limited the breakout.
- Matchup quality drives rushing efficiency more than talent does. Hall’s 1.62-yard-per-carry swing between bottom-10 and top-10 run defenses was larger than any change in his own play.
- Yards after contact separate the back from the line. At 65%, Hall was creating his own production behind a front that gave him 2.5 yards before contact per attempt.
- Touchdowns are a team stat wearing a player’s jersey. A 1.6% rushing touchdown rate reflects a 31st-ranked red zone offense, not a goal-line failure.
- Availability compounds. Sixteen starts turned a 4.4-yard average into a 1,000-yard season and a $45.75 million contract.
- Wins follow efficiency, not carries. Hall averaged 4.90 yards per carry in the Jets’ three wins and 4.22 in their 13 losses, despite getting more carries per game in the losses.
Frequently Asked Questions
How many rushing yards did Breece Hall have in 2025?
Breece Hall rushed for 1,065 yards in 2025, a career high, on 243 carries across 16 games. He became the first New York Jets running back to top 1,000 yards in a season since Chris Ivory in 2015.
What were Breece Hall’s full 2025 stats?
Hall finished with 243 carries for 1,065 rushing yards and four rushing touchdowns, plus 36 receptions on 48 targets for 350 receiving yards and one touchdown. That gave him 1,415 yards from scrimmage and five total touchdowns, with two fumbles lost.
What was Breece Hall’s best game of the 2025 season?
Week 8 at Cincinnati. Hall carried 18 times for 133 yards at 7.4 yards per attempt with two touchdowns in the Jets’ 39–38 win, their first of the season. He followed it with a 111-yard, one-touchdown performance against New England in Week 17.
Did Breece Hall get a contract extension from the Jets?
Yes. On May 8, 2026, Hall signed a three-year, $45.75 million extension with $29 million guaranteed and an average annual value of $15.25 million. That makes him the third-highest-paid running back in the NFL, behind Saquon Barkley and Christian McCaffrey.
Why was Breece Hall’s yards per carry only 4.4?
Hall faced an average of 7.22 defenders in the box per carry because the Jets finished 32nd in net passing yards and defenses loaded up to stop the run. He also had 13.6% of his carries stopped at or behind the line of scrimmage, and 65% of his total yardage came after contact.
How did Breece Hall perform in Jets wins versus losses?
He averaged 4.90 yards per carry with four total touchdowns across New York’s three victories, compared to 4.22 yards per carry and one touchdown across their 13 defeats — despite getting more carries per game in the losses.
Will Breece Hall be a good fantasy football pick in 2026?
His workload floor is secure after the extension, but his value hinges on touchdown regression. The Jets added quarterback Geno Smith and coordinator Frank Reich; if the red zone offense improves from 31st, Hall’s five-touchdown ceiling should rise substantially.
Conclusion
Breece Hall’s 2025 season is the clearest case study in why rushing yards alone never settle an argument. He carried the ball 243 times, broke 40 tackles, generated 65% of his production after contact, and became the first Jet in a decade to run for 1,000 yards — all while playing behind the worst passing offense in football and a defense that did not intercept a single pass all year. The efficiency numbers that look merely fine were produced against stacked boxes that were stacked precisely because his teammates could not throw, and the moment New York won a game, Hall’s average jumped by nearly seven-tenths of a yard per carry. Individual brilliance kept the Jets’ offense functional; it could not make it good. The $45.75 million extension is a bet that with competent quarterback play around him, the gap between what Hall produced and what he is capable of finally closes.