Baltimore Ravens vs Cleveland Browns: Full Player Stats
Two Games, Two Very Different Stories
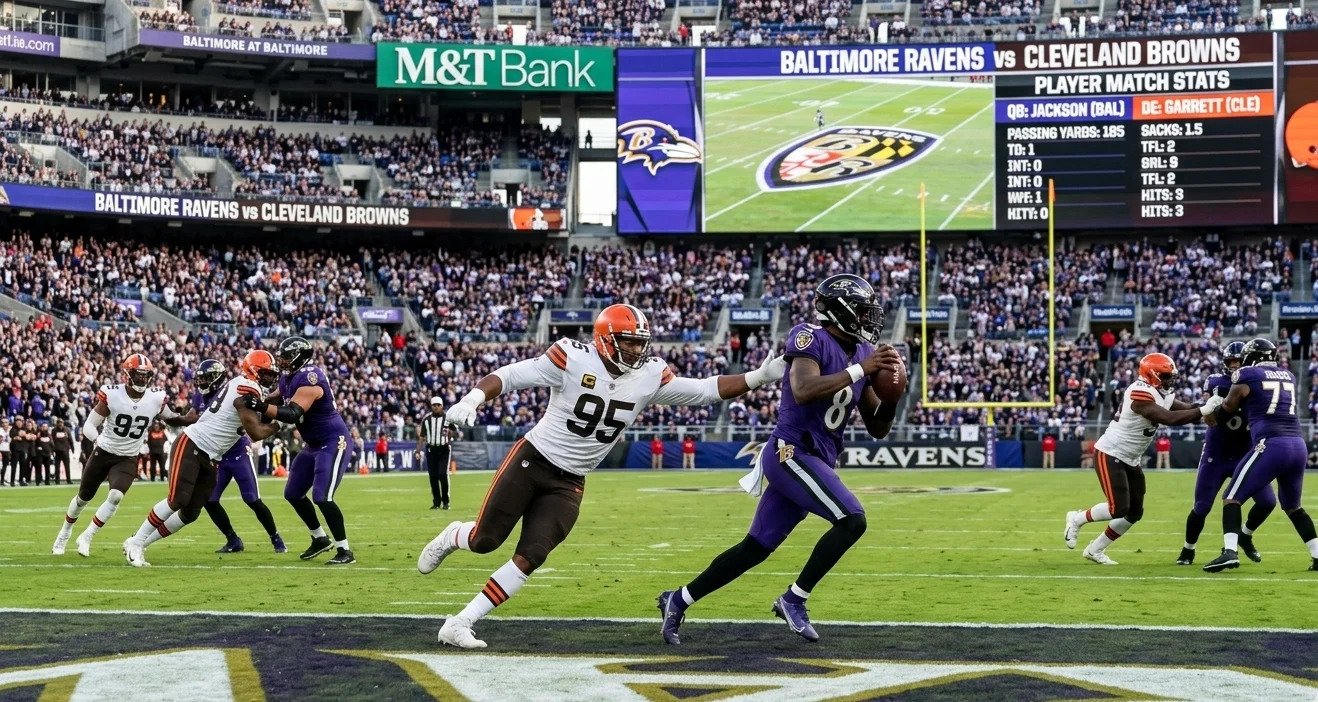
The Baltimore Ravens and Cleveland Browns met twice in the 2025 NFL regular season. In Week 2, Baltimore dominated at home, winning 41–17 in a statement performance. In Week 10, Cleveland pushed hard at home and led by six points heading into the fourth quarter — before Baltimore found a way to close it out 23–16. If you want the full Baltimore Ravens vs Cleveland Browns match player stats for both contests, this is the complete, data-verified record covering every meaningful number from both games.
2025 Season Series: Quick Results Summary
| Game | Date | Location | Winner | Final Score |
|---|---|---|---|---|
| Game 1 — Week 2 | September 14, 2025 | M&T Bank Stadium, Baltimore | Baltimore Ravens | BAL 41 – CLE 17 |
| Game 2 — Week 10 | November 16, 2025 | Huntington Bank Field, Cleveland | Baltimore Ravens | BAL 23 – CLE 16 |
Baltimore swept the series in 2025, outscoring Cleveland 64–33 across both matchups. The Ravens won the AFC North head-to-head matchup convincingly, though the second game was far tighter than the final score suggests.
Game 1 Full Match Stats: Baltimore Ravens 41 – Cleveland Browns 17 (September 14, 2025)
Scoring by Quarter — Game 1
| Quarter | Baltimore Ravens | Cleveland Browns |
|---|---|---|
| Q1 | 3 | 0 |
| Q2 | 7 | 3 |
| Q3 | 10 | 7 |
| Q4 | 21 | 7 |
| Final | 41 | 17 |
Baltimore opened with a field goal, went up double digits by halftime, and then broke the game open with 21 fourth-quarter points — including a forced fumble returned for a touchdown — to put Cleveland away decisively.
Game 1 Team Stats — Side-by-Side Comparison
| Stat Category | Baltimore Ravens | Cleveland Browns |
|---|---|---|
| Total Yards | 242 | 322 |
| Plays Run | 53 | 72 |
| Average Gain Per Play | 4.6 | 4.5 |
| Time of Possession | 28:11 | 31:49 |
| First Downs (Total) | 14 | 17 |
| First Downs — Pass | 10 | 10 |
| First Downs — Rush | 2 | 7 |
| First Downs — Penalty | 2 | 0 |
| Turnovers | 0 | 2 |
| Penalties | 6 | 6 |
| Penalty Yards | 28 | 42 |
| Fumbles | 1 | 1 |
| Fumbles Lost | 0 | 1 |
Cleveland actually out-gained Baltimore in total yards (322 vs 242) and held the ball longer. The difference came down to turnovers — Cleveland lost a fumble that Baltimore returned for a touchdown and threw an interception that Baltimore returned 61 yards. Zero turnovers versus two costly turnovers defined the final margin more than any other single factor.
Game 1 Passing Stats
| Stat | Baltimore Ravens (L. Jackson) | Cleveland Browns (J. Flacco / D. Gabriel) |
|---|---|---|
| Pass Attempts | 29 | 48 |
| Completions | 19 | 28 |
| Completion % | 65.5% | 58.3% |
| Passing Yards | 225 | 218 |
| Touchdowns | 4 | 2 |
| Interceptions | 0 | 1 |
| Sacks Taken | 3 | 2 |
| Sack Yards Lost | 28 | 11 |
| Passer Rating | 128.6 | 74.8 |
| Longest Completion | 41 yds | 26 yds |
| Longest TD Pass | 24 yds | 18 yds |
| Poor Throws | 4 | 6 |
| Throw-Aways | 1 | 6 |
Lamar Jackson delivered a dominant passing performance — four touchdown passes with zero interceptions and a 128.6 passer rating. Cleveland used multiple passers across the game, with Joe Flacco taking snaps before Deshawn Gabriel finished drives late. The 53.8-point passer rating gap between the two units tells the complete offensive story.
Game 1 Rushing Stats
| Stat | Baltimore Ravens | Cleveland Browns |
|---|---|---|
| Rush Attempts | 21 | 22 |
| Rushing Yards | 45 | 115 |
| Average Per Carry | 2.1 | 5.2 |
| Rush Touchdowns | 0 | 0 |
| Longest Run | 11 yds | 31 yds |
| Red Zone Rush Attempts | 2 | 0 |
| First Downs Rushing | 2 | 7 |
| Yards After Contact | 18 | 54 |
Cleveland’s running game produced 115 yards at 5.2 yards per carry and won the rushing battle comfortably. Baltimore’s run game struggled, averaging just 2.1 yards per attempt. However, Baltimore’s passing attack was so dominant that the ground game imbalance never became a problem.
Game 1 Receiving Stats
| Stat | Baltimore Ravens | Cleveland Browns |
|---|---|---|
| Targets | 28 | 41 |
| Receptions | 19 | 28 |
| Receiving Yards | 225 | 218 |
| Receiving Touchdowns | 4 | 2 |
| Yards After Catch | 66 | 96 |
| Longest Reception | 41 yds | 26 yds |
| Air Yards | 159 | 122 |
| Red Zone Targets | 5 | 3 |
| Dropped Passes | 1 | 3 |
Notable Game 1 scoring plays from the receiving group:
- T. Wallace caught a 15-yard touchdown in Q2
- D. Walker caught a 2-yard touchdown in Q3 and a 24-yard touchdown in Q4
- D. Hopkins caught a 23-yard touchdown in Q4
- C. Tillman caught an 18-yard touchdown for Cleveland in Q3
- D. Sampson caught an 8-yard touchdown for Cleveland late in Q4
Game 1 Defensive Stats
| Stat | Baltimore Ravens Defense | Cleveland Browns Defense |
|---|---|---|
| Total Tackles | 39 | 24 |
| Assisted Tackles | 25 | 25 |
| Combined Tackles | 64 | 49 |
| Sacks | 2.0 | 3.0 |
| Sack Yards | 11 | 28 |
| Interceptions | 1 | 0 |
| Passes Defended | 5 | 5 |
| Forced Fumbles | 1 | 1 |
| Fumble Recoveries | 1 | 0 |
| QB Hits | 9 | 5 |
| Tackles for Loss | 7.0 | 5.0 |
| TFL Yards | 18 | 25 |
| Blitzes Sent | 13 | 9 |
| Hurries Generated | 4 | 1 |
| Missed Tackles | 2 | 3 |
Baltimore’s defense forced two turnovers — one interception returned 61 yards and one fumble recovery returned 63 yards for a touchdown. Those 124 return yards off turnovers directly translated into 14 points, which represented the entire winning margin and then some.
Game 1 Special Teams Stats
| Stat | Baltimore Ravens | Cleveland Browns |
|---|---|---|
| Field Goals Made / Attempted | 2/2 (100%) | 1/1 (100%) |
| Longest Field Goal | 43 yds | 38 yds |
| Punts | 5 | 6 |
| Punt Average Yards | 51.8 | 37.2 (net) |
| Longest Punt | 58 yds | 53 yds |
| Punts Blocked | 0 | 1 |
| Kick Returns | 3 for 79 yds | 5 for 94 yds |
| Punt Returns | 1 for 23 yds | 1 for 0 yds |
Baltimore’s punter averaged 51.8 yards per attempt and placed two kicks inside the Cleveland 20-yard line. Cleveland had a punt blocked in the game, which handed Baltimore additional field position at a critical moment.
Game 2 Full Match Stats: Cleveland Browns 16 – Baltimore Ravens 23 (November 16, 2025)
Scoring by Quarter — Game 2
| Quarter | Cleveland Browns | Baltimore Ravens |
|---|---|---|
| Q1 | 3 | 3 |
| Q2 | 13 | 7 |
| Q3 | 0 | 0 |
| Q4 | 0 | 13 |
| Final | 16 | 23 |
This game told a completely different story from the Week 2 blowout. Cleveland led 16–10 heading into the fourth quarter, with two interceptions returned for touchdowns putting them in control. Baltimore’s fourth-quarter rally — built on the ground game and three field goals — sealed a comeback win that the Ravens earned through persistence rather than dominance.
Game 2 Team Stats — Side-by-Side Comparison
| Stat Category | Cleveland Browns | Baltimore Ravens |
|---|---|---|
| Total Yards | 187 | 351 |
| Plays Run | 54 | 60 |
| Average Gain Per Play | 3.5 | 5.9 |
| Time of Possession | 27:01 | 32:59 |
| First Downs (Total) | 10 | 17 |
| First Downs — Pass | 4 | 9 |
| First Downs — Rush | 5 | 8 |
| First Downs — Penalty | 1 | 0 |
| Turnovers | 1 | 3 |
| Penalties | 5 | 4 |
| Penalty Yards | 41 | 26 |
| Fumbles | 1 | 1 |
| Fumbles Lost | 0 | 1 |
Baltimore out-gained Cleveland by 164 yards and held the ball for nearly six minutes more, yet found themselves trailing in the fourth quarter. Cleveland’s defense intercepted Lamar Jackson twice and returned one pick for a touchdown — turning a statistical disadvantage into a scoreboard lead that held until the final three minutes.
Game 2 Passing Stats
| Stat | Cleveland Browns (QB) | Baltimore Ravens (L. Jackson) |
|---|---|---|
| Pass Attempts | 26 | 25 |
| Completions | 11 | 14 |
| Completion % | 42.3% | 56.0% |
| Passing Yards | 115 | 193 |
| Touchdowns | 0 | 0 |
| Interceptions | 1 | 2 |
| Sacks Taken | 3 | 5 |
| Sack Yards Lost | 34 | 26 |
| Passer Rating | 39.7 | 47.6 |
| Longest Completion | 26 yds | 45 yds |
| Poor Throws | 4 | 7 |
| Passes Defended Against | 9 | 2 |
Neither passing game performed cleanly in Game 2. Cleveland’s 39.7 passer rating was historically poor, yet Cleveland still led heading into the fourth quarter. Baltimore threw for zero touchdowns despite 193 passing yards. Both offenses leaned on the run game and special teams to generate points rather than through the air.
Game 2 Rushing Stats
| Stat | Cleveland Browns | Baltimore Ravens |
|---|---|---|
| Rush Attempts | 25 | 30 |
| Rushing Yards | 106 | 184 |
| Average Per Carry | 4.2 | 6.1 |
| Rush Touchdowns | 0 | 2 |
| Longest Run | 19 yds | 59 yds |
| Red Zone Rush Attempts | 4 | 8 |
| First Downs Rushing | 5 | 8 |
| Yards After Contact | 69 | 108 |
Baltimore’s ground game was the true offensive engine in Game 2. The Ravens ran 30 times for 184 yards at 6.1 yards per carry with two rushing touchdowns. The most decisive play of the game came from Mark Andrews, who took a direct snap and ran 35 yards for the go-ahead touchdown with 2:39 remaining — the play that sealed Baltimore’s come-from-behind victory.
Game 2 Receiving Stats
| Stat | Cleveland Browns | Baltimore Ravens |
|---|---|---|
| Targets | 25 | 25 |
| Receptions | 11 | 14 |
| Receiving Yards | 115 | 193 |
| Receiving Touchdowns | 0 | 0 |
| Yards After Catch | 44 | 106 |
| Longest Reception | 26 yds | 45 yds |
| Air Yards | 71 | 87 |
| Dropped Passes | 1 | 2 |
Baltimore’s receivers gained 106 yards after the catch — nearly double Cleveland’s 44 yards after contact. That yards-after-catch gap reflects Baltimore’s receivers breaking tackles and creating extra yardage in a game where chunk plays through the air were rare for both teams.
Game 2 Defensive Stats
| Stat | Cleveland Browns Defense | Baltimore Ravens Defense |
|---|---|---|
| Total Tackles | 36 | 28 |
| Assisted Tackles | 19 | 24 |
| Combined Tackles | 55 | 52 |
| Sacks | 5.0 | 3.0 |
| Sack Yards | 26 | 34 |
| Interceptions | 2 | 1 |
| Passes Defended | 3 | 9 |
| Forced Fumbles | 0 | 1 |
| QB Hits | 7 | 10 |
| Tackles for Loss | 10.0 | 6.0 |
| TFL Yards | 34 | 27 |
| Blitzes Sent | 20 | 18 |
| Hurries Generated | 3 | 4 |
| Missed Tackles | 8 | 6 |
Cleveland’s defense produced its best performance of the series in Game 2 — five sacks, two interceptions (one returned for a touchdown by D. Bush from 23 yards out), and 10 tackles for loss. Despite that defensive output, the Browns could not score a single point in the second half, and one missed stop in the fourth quarter proved fatal.
Game 2 Special Teams Stats
| Stat | Cleveland Browns | Baltimore Ravens |
|---|---|---|
| Field Goals Made / Attempted | 3/3 (100%) | 3/3 (100%) |
| Longest Field Goal | 46 yds | 44 yds |
| Punts | 6 | 4 |
| Punt Average Yards | 49.8 | 44.0 |
| Kick Returns | 5 for 123 yds | 4 for 115 yds |
| Punt Returns | 2 for 18 yds | 3 for 26 yds |
Both kickers went a perfect 3-for-3 on field goals. Cleveland’s A. Szmyt hit attempts from 24, 30, and 46 yards. Baltimore’s T. Loop converted from 25, 24, and 44 yards — including the 44-yarder in Q4 that tied the game at 16 and set up the final drive.
2025 Series Head-to-Head Combined Stats
| Category | Baltimore Ravens (Total) | Cleveland Browns (Total) |
|---|---|---|
| Total Points Scored | 64 | 33 |
| Total Yards | 593 | 509 |
| Total Passing Yards | 418 | 333 |
| Total Rushing Yards | 229 | 221 |
| Total Touchdowns | 7 | 3 |
| Total Turnovers | 3 | 3 |
| Total Sacks Taken | 8 | 5 |
| Total Penalties | 10 | 11 |
| Total Penalty Yards | 54 | 83 |
| Field Goals Made | 5 / 5 | 4 / 4 |
| Passer Rating (avg) | 88.1 | 57.3 |
Both teams finished with identical turnovers across the series (3 each), but Baltimore’s passer rating advantage of 30.8 points per game tells the clearest story of why the Ravens won both contests.
Key Players Who Defined the 2025 Series
Lamar Jackson (QB — Baltimore Ravens)
Jackson was the central figure in both games. In Game 1, he delivered four touchdown passes with zero interceptions and a 128.6 passer rating in a commanding win. Game 2 saw him throw two costly interceptions, but his ability to manage the fourth quarter and the team’s commitment to the ground game kept Baltimore competitive when the passing game faltered.
Mark Andrews (TE — Baltimore Ravens)
Andrews delivered the most dramatic individual play of the series — a direct-snap 35-yard touchdown run with 2:39 remaining in Game 2 that broke a 16–16 tie and gave Baltimore the lead they would not surrender. His presence as a blocker also supported the rushing attack that carried Baltimore through the second half.
D. Walker (WR — Baltimore Ravens)
Walker caught two touchdowns in Game 1, including a 24-yard score in the fourth quarter that began Baltimore’s decisive scoring run.
D. Hopkins (WR — Baltimore Ravens)
Hopkins caught a 23-yard fourth-quarter touchdown in Game 1, one of four receiving scores on the day.
D. Bush (LB — Cleveland Browns)
Bush intercepted Lamar Jackson and returned it 23 yards for a touchdown in Game 2’s second quarter — the play that gave Cleveland a 12–3 lead and momentum that lasted until the final three minutes.
A. Szmyt (K — Cleveland Browns)
Szmyt went 4-for-4 on field goals across the series, including a clutch 46-yarder. His perfect kicking kept Cleveland competitive in both games despite offensive limitations.
T. Loop (K — Baltimore Ravens)
Loop went 5-for-5 across both games, including five consecutive successful attempts when Baltimore needed points without a touchdown-generating offense. His 44-yarder in Q4 of Game 2 tied the score and forced Cleveland to defend a final drive.
Frequently Asked Questions — Baltimore Ravens vs Cleveland Browns Match Player Stats
Q1: What were the final scores of the Baltimore Ravens vs Cleveland Browns games in 2025?
Baltimore won both games. Game 1 (Week 2, September 14) ended Baltimore 41 – Cleveland 17 at M&T Bank Stadium. Game 2 (Week 10, November 16) ended Cleveland 16 – Baltimore 23 at Huntington Bank Field. Baltimore swept the 2025 regular season series, outscoring Cleveland 64–33 across both matchups.
Q2: How did Lamar Jackson perform in the Baltimore Ravens vs Cleveland Browns match player stats?
Jackson produced dramatically different numbers across the two games. In Game 1, he completed 19 of 29 passes for 225 yards, four touchdowns, zero interceptions, and a 128.6 passer rating. In Game 2, he completed 14 of 25 passes for 193 yards, no touchdowns, two interceptions, and a 47.6 passer rating. His rushing contribution in Game 2 proved more important than his passing output.
Q3: Who scored the winning touchdown in Game 2 of the 2025 Ravens vs Browns series?
Mark Andrews scored the decisive touchdown in Game 2. With Cleveland leading 16–13 late in the fourth quarter, Andrews took a direct snap and ran 35 yards to the right end zone with 2:39 remaining. T. Loop converted the extra point, putting Baltimore ahead 23–16 — a lead Cleveland could not overcome in the final minutes.
Q4: Which defense performed better across the two games?
Both defenses had strong individual moments. Baltimore’s defense was superior in Game 1, forcing two turnovers that produced 14 direct points. Cleveland’s defense outperformed in Game 2 — recording five sacks, two interceptions, and 10 tackles for loss. The defining difference across the series was that Baltimore’s defense avoided giving up big plays in critical moments, while Cleveland’s defense could not stop Baltimore’s final fourth-quarter drives.
Q5: How did the Cleveland Browns lose Game 2 despite leading in the fourth quarter?
Cleveland led 16–10 heading into Q4 behind two defensive touchdowns and three A. Szmyt field goals. Baltimore scored 13 unanswered points in the fourth quarter — two T. Loop field goals and the Mark Andrews 35-yard touchdown run. Cleveland’s offense, which held the ball for only 27 minutes and completed just 42.3% of its passes, could not generate a response drive once Baltimore took the lead.
Q6: What was the total yards comparison in the Baltimore Ravens vs Cleveland Browns match player stats across both games?
Across the full two-game series, Baltimore accumulated 593 total yards (418 passing, 229 rushing) against Cleveland’s 509 total yards (333 passing, 221 rushing). The 84-yard total yardage advantage for Baltimore, combined with a 30.8-point passer rating edge per game, explains the results more clearly than any other single statistic.
The Numbers Tell the Full Story — Now You Have All of Them
The Baltimore Ravens vs Cleveland Browns match player stats across both 2025 games show a rivalry that played out in completely different styles. Game 1 was a masterclass in efficiency — four Lamar Jackson touchdown passes, zero turnovers, and a second-half statement. Game 2 was a survival test — two Jackson interceptions, a fourth-quarter deficit, and a 35-yard Mark Andrews run that ended Cleveland’s upset bid.
Baltimore won the series on the strength of superior passing efficiency, clutch kicking, and fourth-quarter composure. Cleveland showed enough defensive capability in Game 2 to prove this rivalry has genuine competitive teeth heading into future seasons.
Bookmark this page as your complete statistical reference for the 2025 Ravens-Browns series. Share it with any fan who wants the real numbers behind both results — not just the final score.
Have a stat question this article did not answer? Drop it in the comments and we will pull the specific figure from the verified match records.